
It's not easy to draw a map of the world of mathematics: it's simply too big and to multidimensional to be mapped in the flat plane without severe distortions and damages.
However, our project "Panorama of Mathematics" wants to give an overview over mathematics on the whole, so we had to try at least. We used two different approaches, which means: classifications of mathematics. The first is the classification by www.arxiv.org which is the world's largest preprint server for Mathematics, Physics and Computer Science. The second approach used the Mathematics Subject Classification of Zentralblatt Math and Mathematical Reviews.
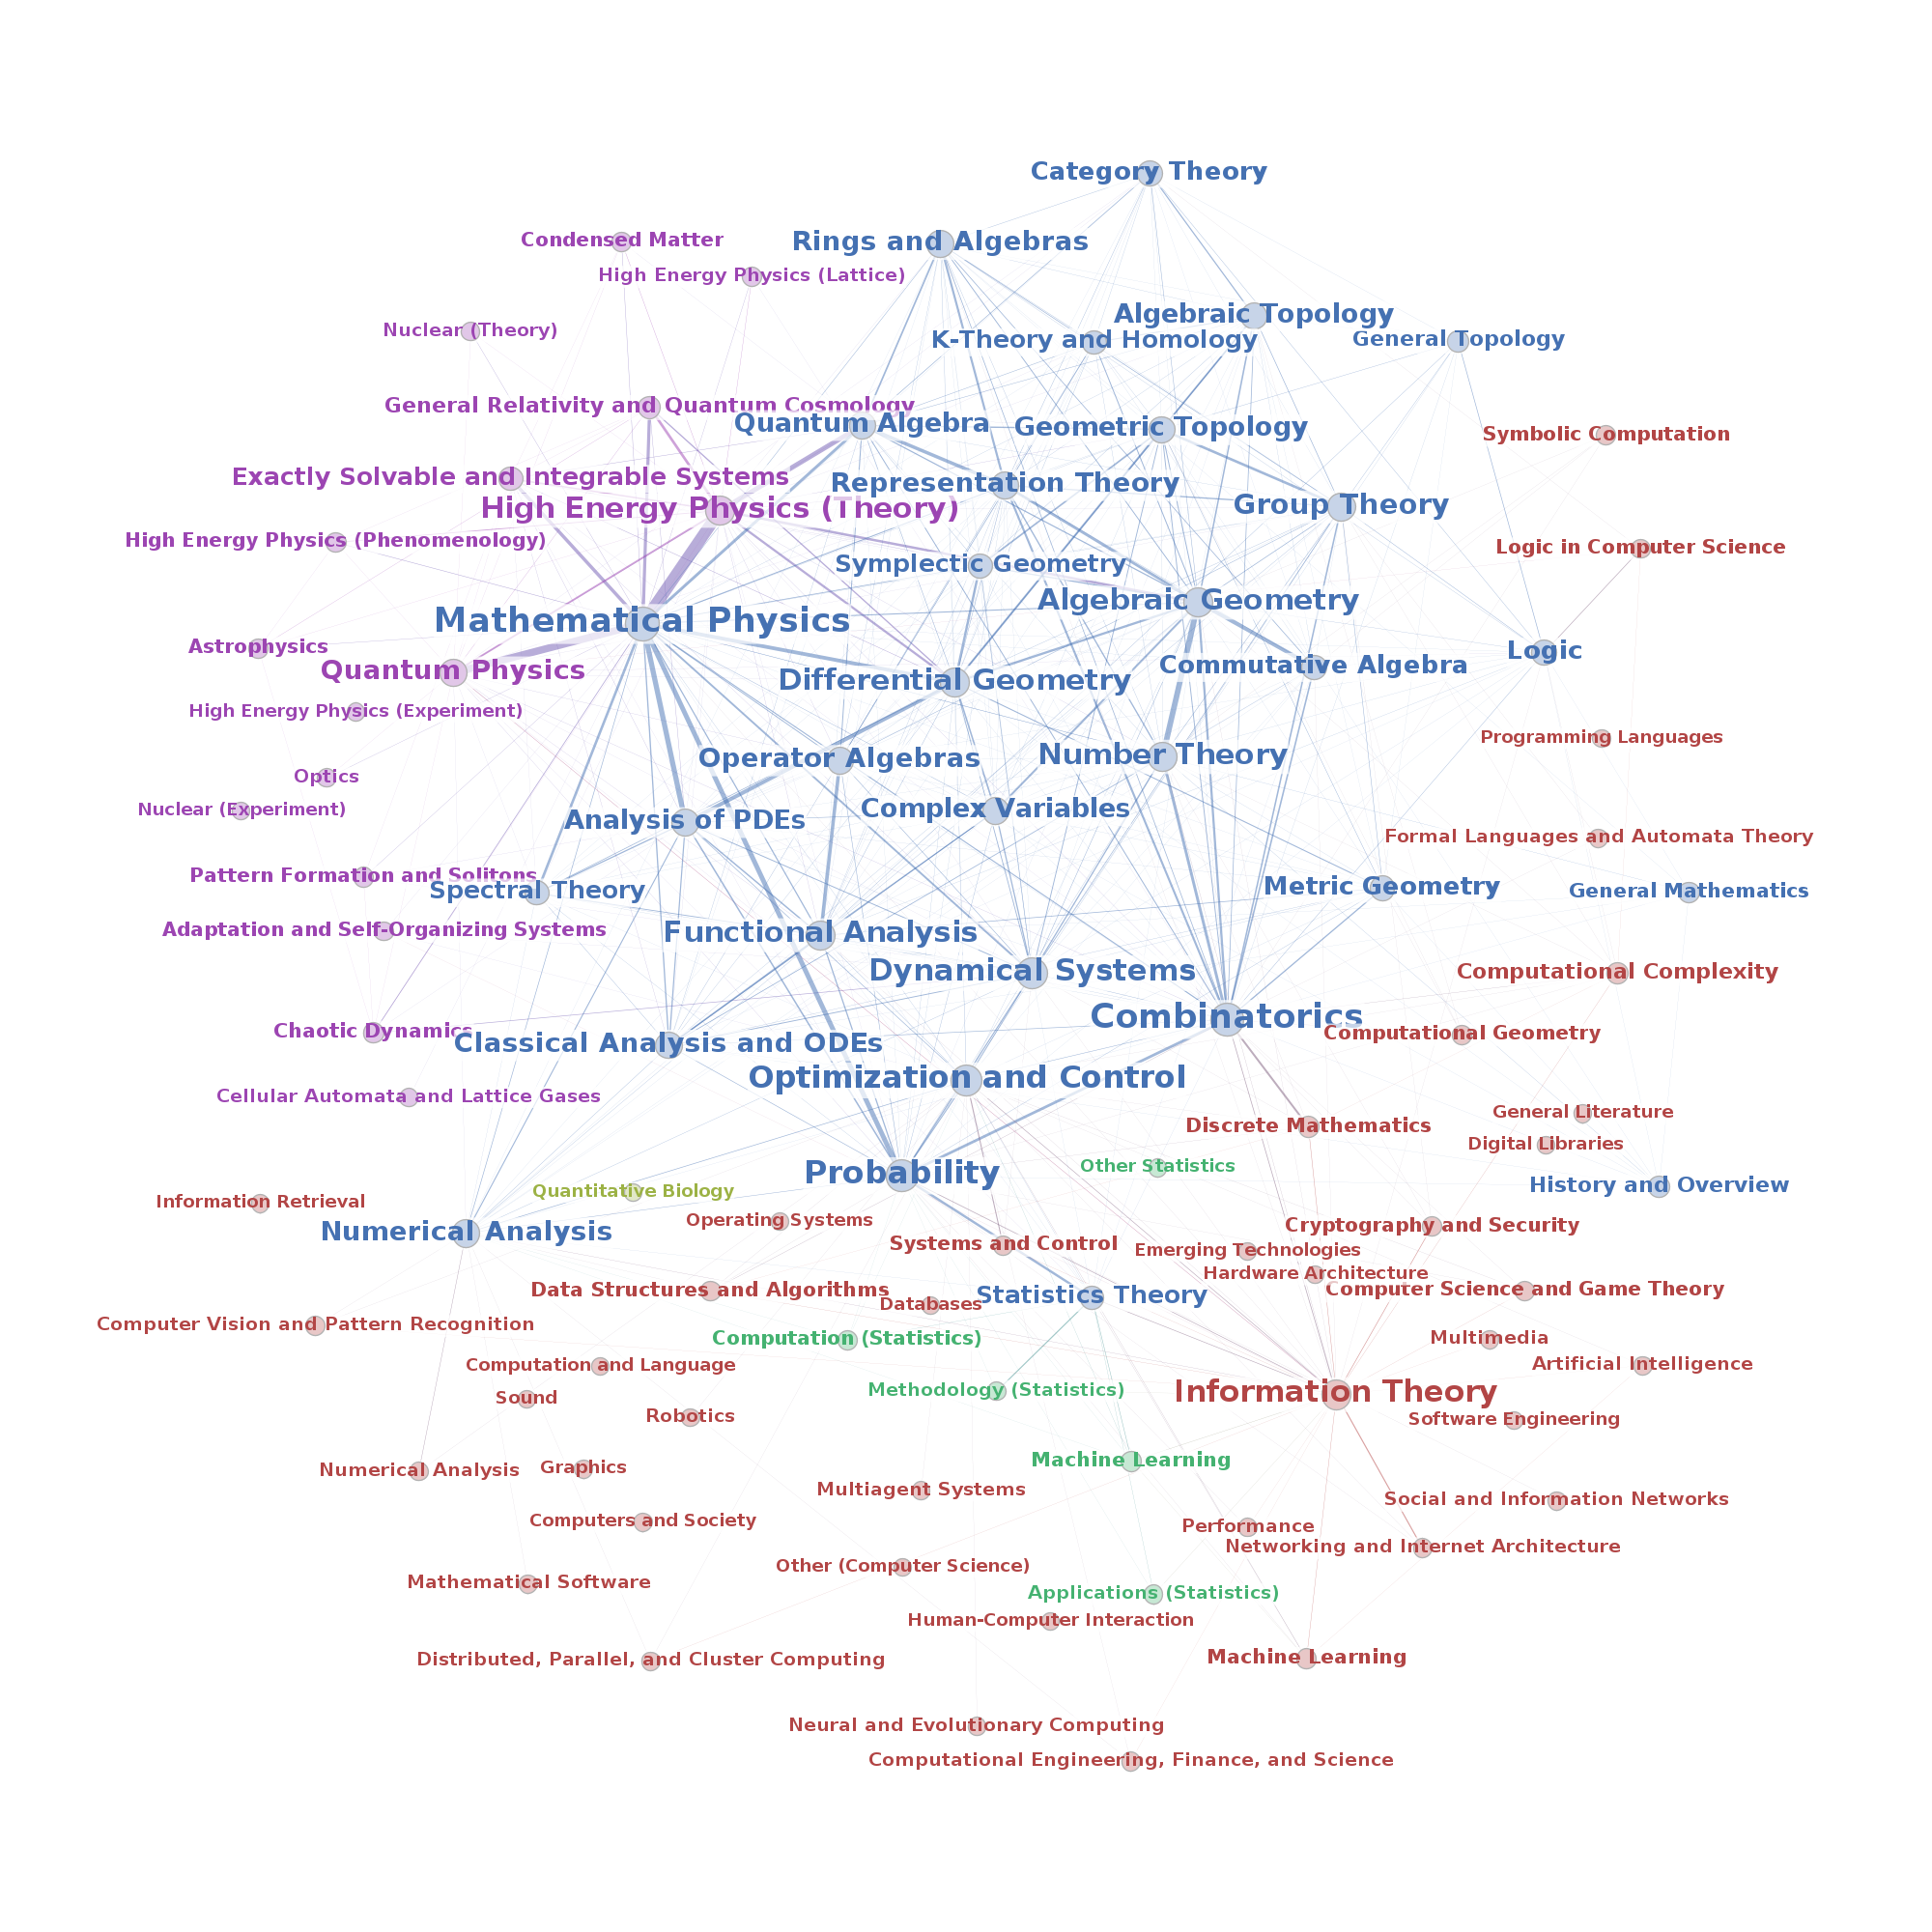
What did we do in detail? In the case of Arxiv, we checked the primary and secondary subjects of papers that appeared between 1992 and 2014. If the authors classified their paper with primary subject A and secondary subject B, then we produced in the graph an edge between subject A and B. The edge weight is the number of papers with the respective combination of subjects. To clear up the graph, we disregarded all edges with edge weight smaller than 20. Moreover, we focused on math papers subjects (blue) and their connections to the other sciences (red: Computer Science, green: Statistics, light green: Biology, magenta: Physics). The connections inside the other sciences are disregarded.
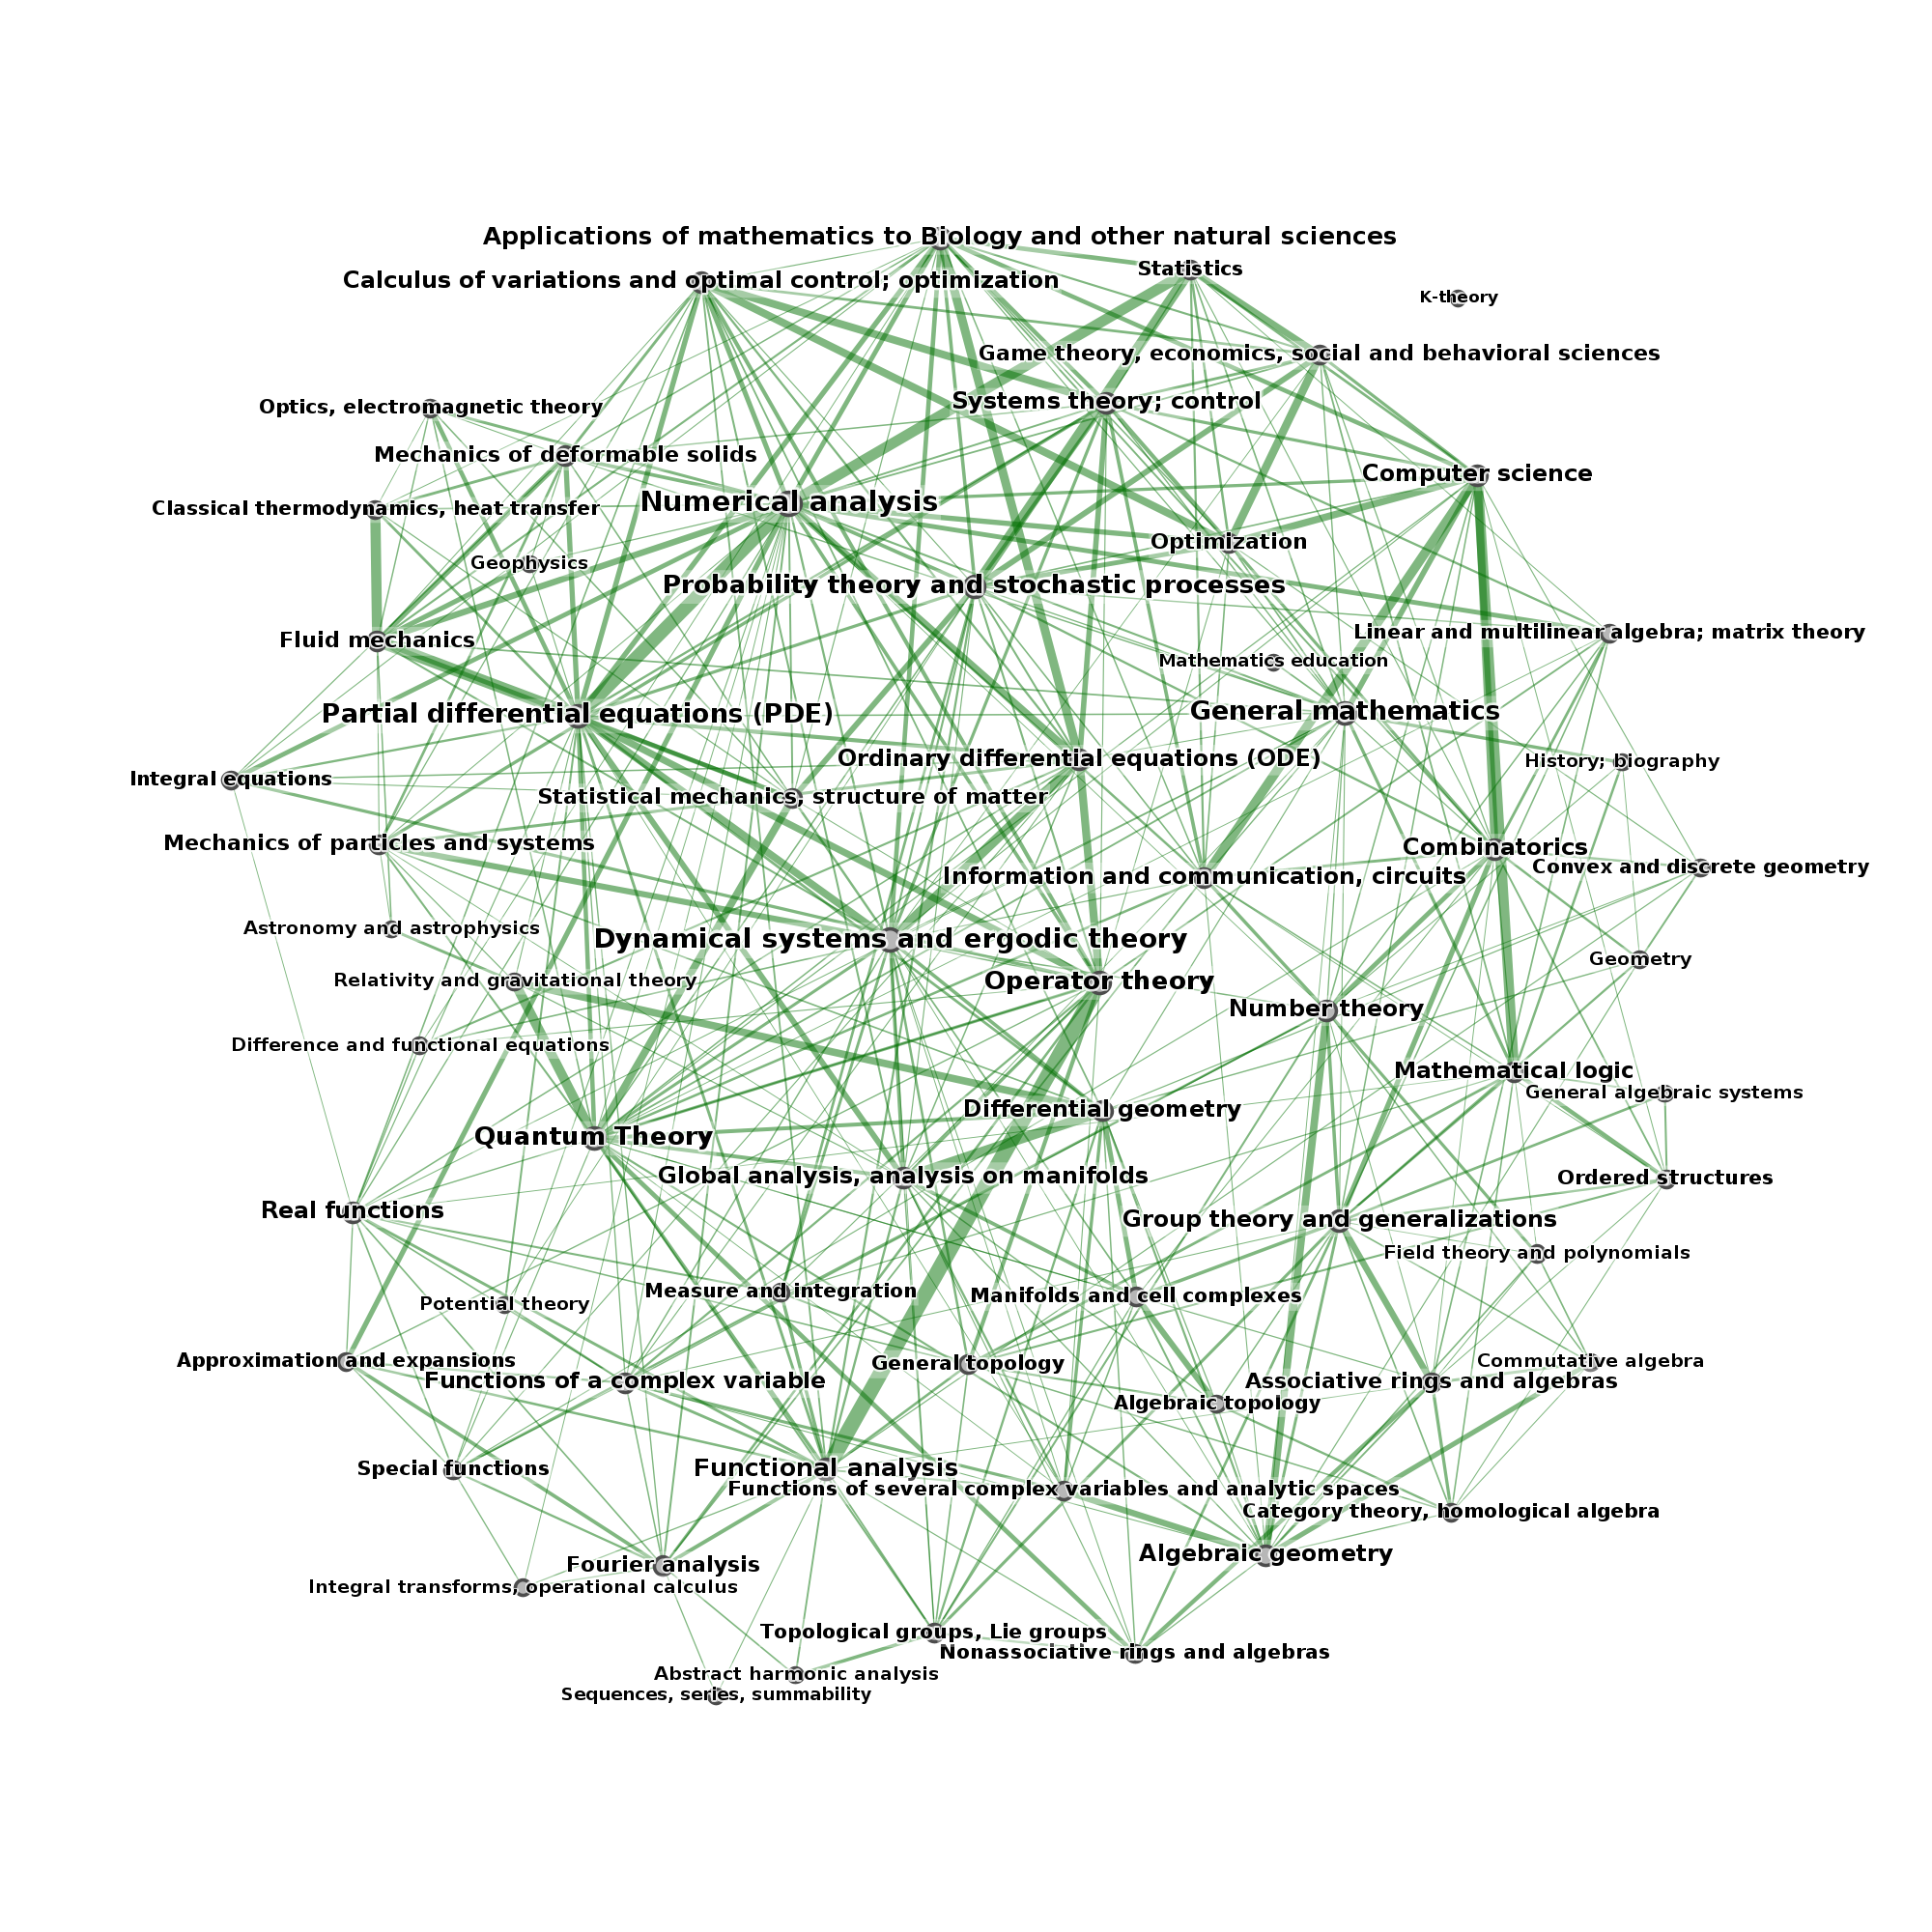
In the case of MSC, we used the statistics Zentralblatt publishes on their site. Here's an example: searching for papers in category 22 ("Topological groups, Lie groups"), Zentralblatt tells you that there are about 5000 papers in that category also belonging to category 43 "Abstract Harmonic Analysis" which produces an edge with weight 5000. Here, we disregarded edges with weight smaller than 2000.
 Andreas Loos